Water stress index – NDWI
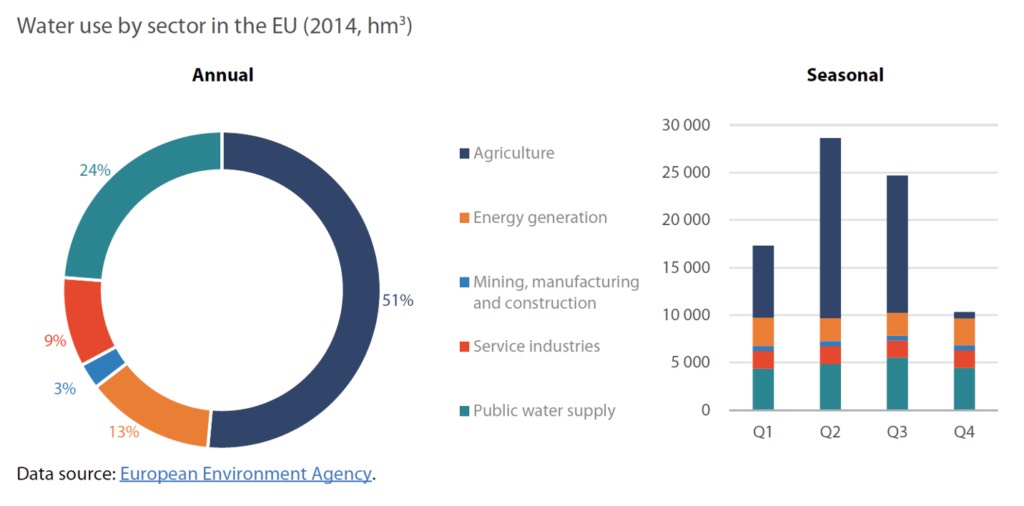
Water scarcity carries a heavy economic impact, because it can trigger direct financial losses, chiefly for growers. In 2014, European Environment Agency figures on water use by sector showed that irrigation in agriculture accounted for 51% of the water used annually, twice the share going to household supply (24%).
To use water efficiently in irrigation management, determining the water content of the plant is essential. Extreme temperatures and reduced rainfall are among the natural phenomena affecting agricultural areas with ever greater frequency.
What water stress is
A lack or reduction of water content gives rise to "water stress". Under stress, the plant alters its internal structure. In order to use its resources efficiently, it can reduce its leaf area and the size of its leaves. If the stress continues over time, it can affect photosynthesis, growth and ultimately productivity.
In plantings such as citrus and grapes, water stress can determine sugar concentration and acidity, seriously compromising fruit quality. In maize, water stress during the reproductive stage can produce a significant reduction in yield.
The Visual NDWI
Remote sensing systems (satellite imagery, drone imagery) make it possible to obtain the water stress index, or NDWI. This indicator tells us the water status or water content of the plants.
At Visual we build the NDWI index from Sentinel-2 imagery. Having images available every 5 days anywhere in the world allows us to track changes over time and at any stage of the phenological cycle.
At Visual we have updated the traditional NDWI into a six-category NDWI index with an adjusted value range and a new colour scale. Negative values close to −1 correspond to bare soil (reds). Values around 0 (from −0.2 to +0.24) usually indicate water stress at different levels, from emerging to severe. And values from +0.4 to 1 indicate an absence of water stress (blues).
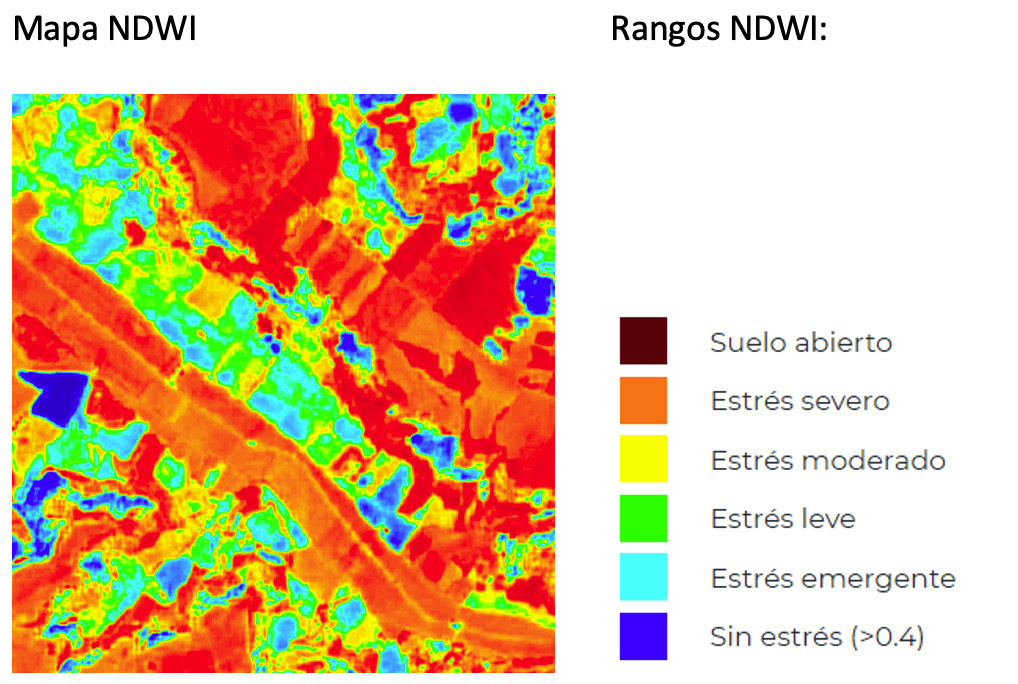
How to read the maps
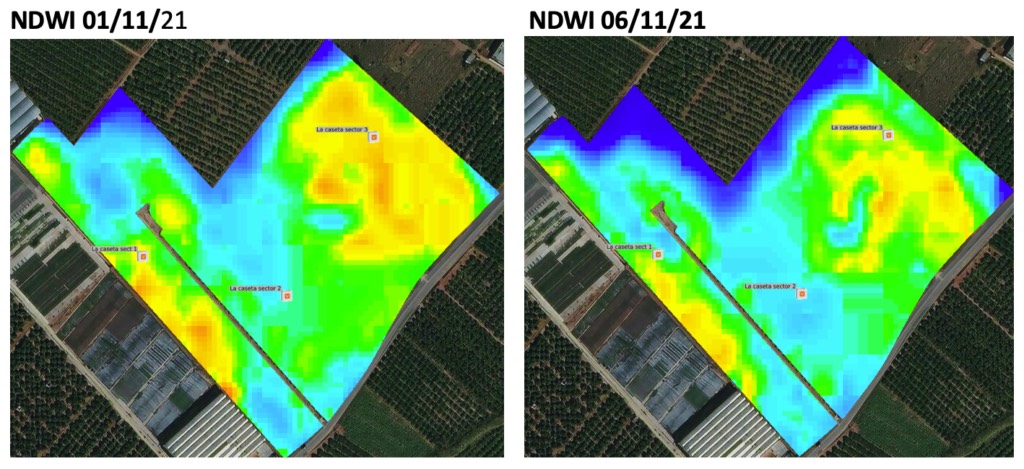
In the NDWI maps below, an area of orange and yellow stands out to the north-east of the plot. Those colours represent water stress at moderate to severe levels. NDWI maps are tools that make it possible to detect, even within a single plot, areas requiring special treatment. In this case they allowed both the amount and the location of irrigation within the plot to be optimised.
NDWI and soil sensors
The chart below shows how soil moisture measured with our sensor evolved between 01/11/21 and 11/11/21. On the dates of the NDWI maps (01/11/21 and 06/11/21) the sensor detected a very low soil moisture percentage (7.5%), coinciding with the high water stress picked up by the maps.
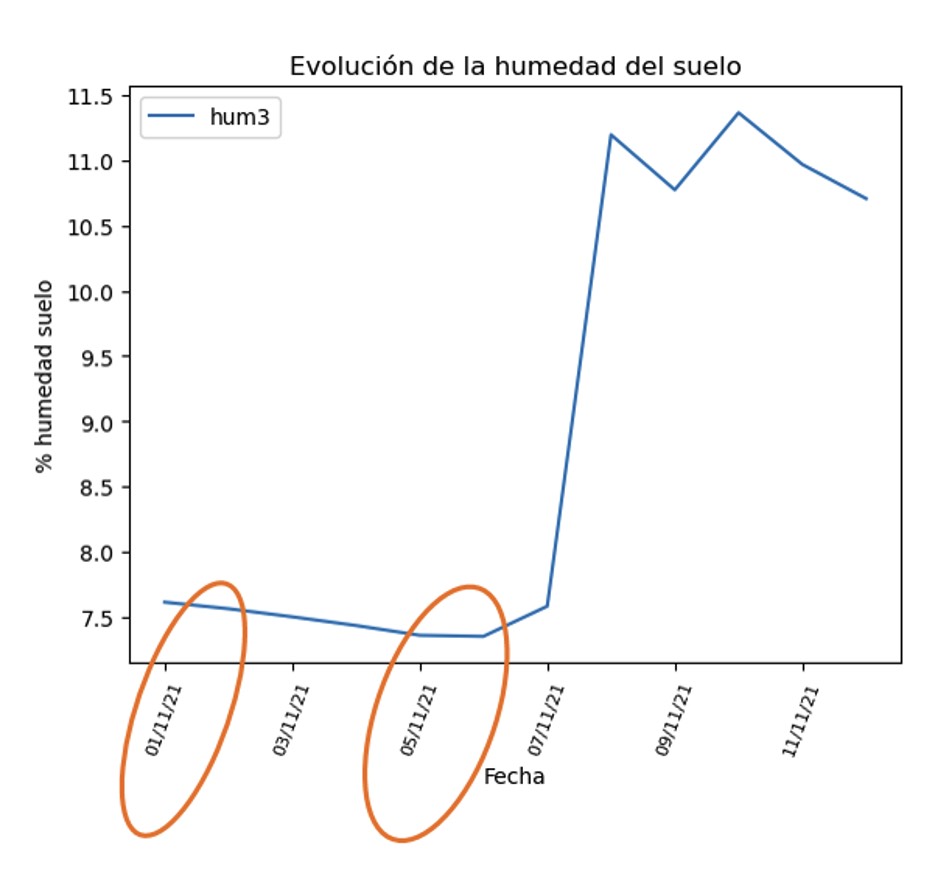
For this reason, and with the aim of improving irrigation planning and strategy, we recommend using NDWI maps together with Visual sensors.
Want to put agricultural remote sensing to work with Visual?
Tell us which crop you manage and we will show you how it applies to your case, using data from your own plots.
Book a demo→