Features / Map view
See on the map where to act.
Plots, layers and alerts on the map, with area measurement, geotagged photos and actions launched from the plot itself.
Book a demoMapYour plots and their layers
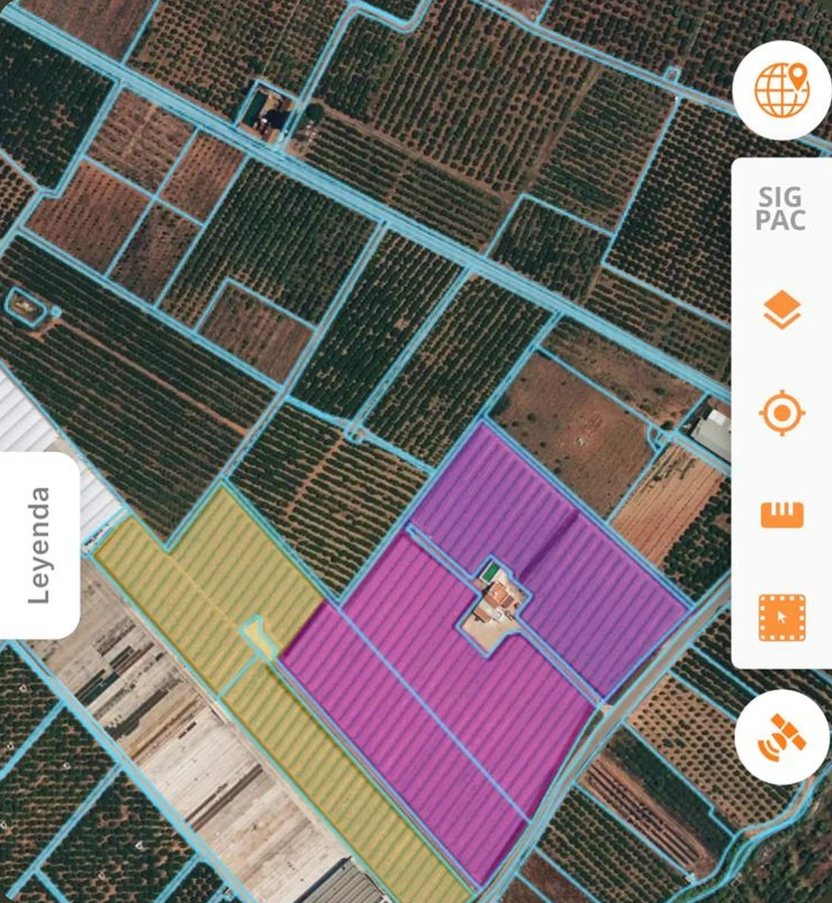
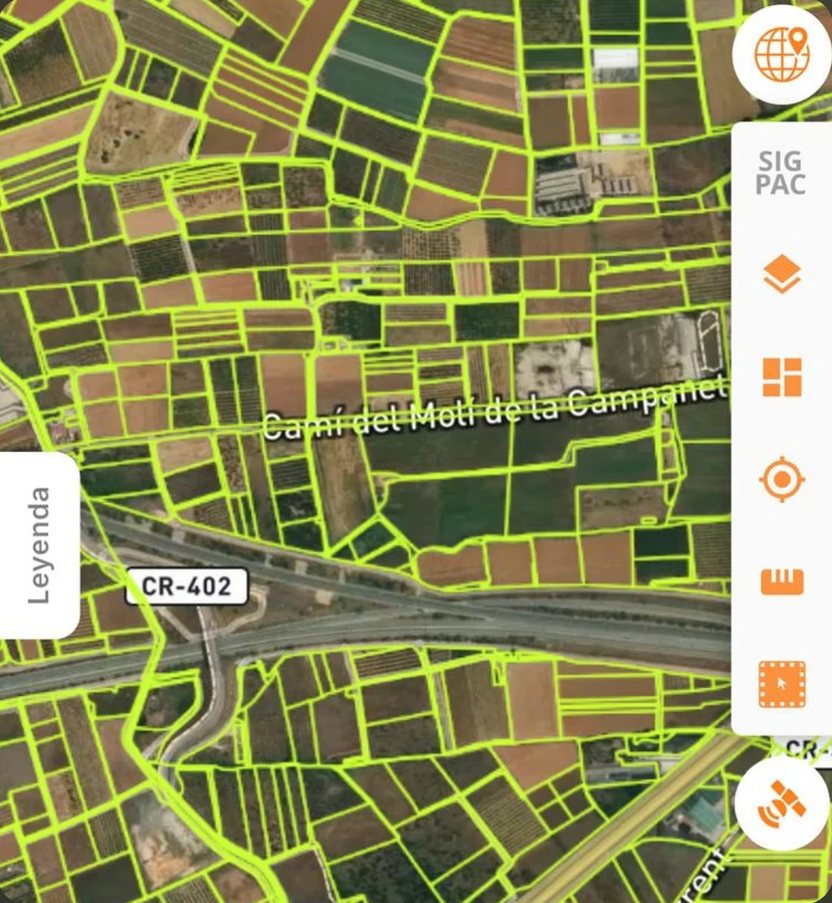
Everything has a place. The map shows it.
Every piece of data in Visual Core is linked to a plot. The map brings it all together so you can see at a glance what needs doing and which alerts are active.
What it does
Plots and layers
SIGPAC (Spain’s land parcel register), the land registry and any layers you need over your plots.
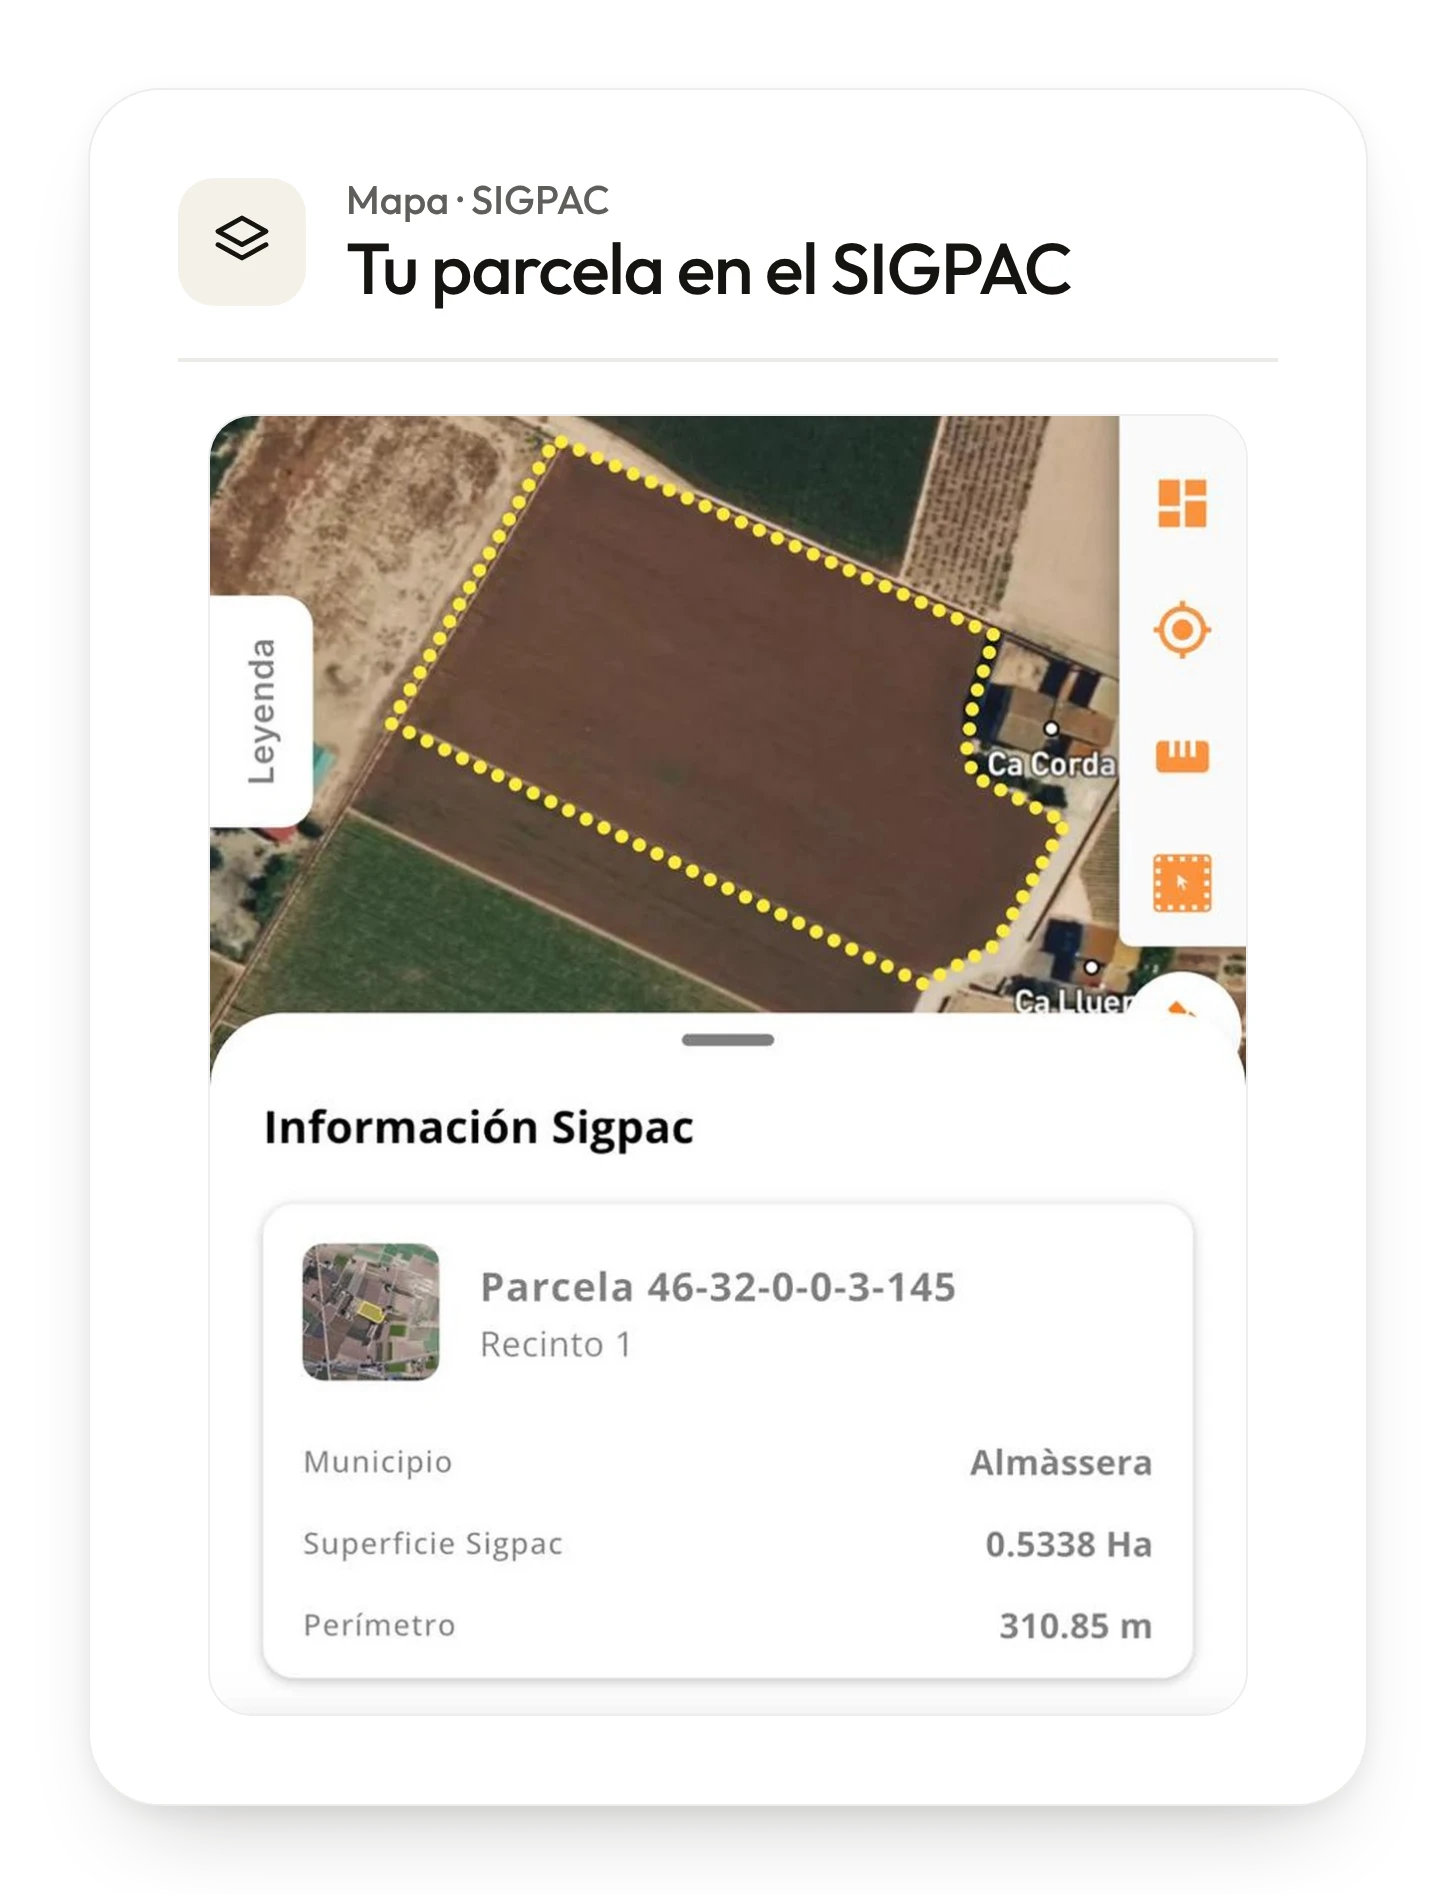
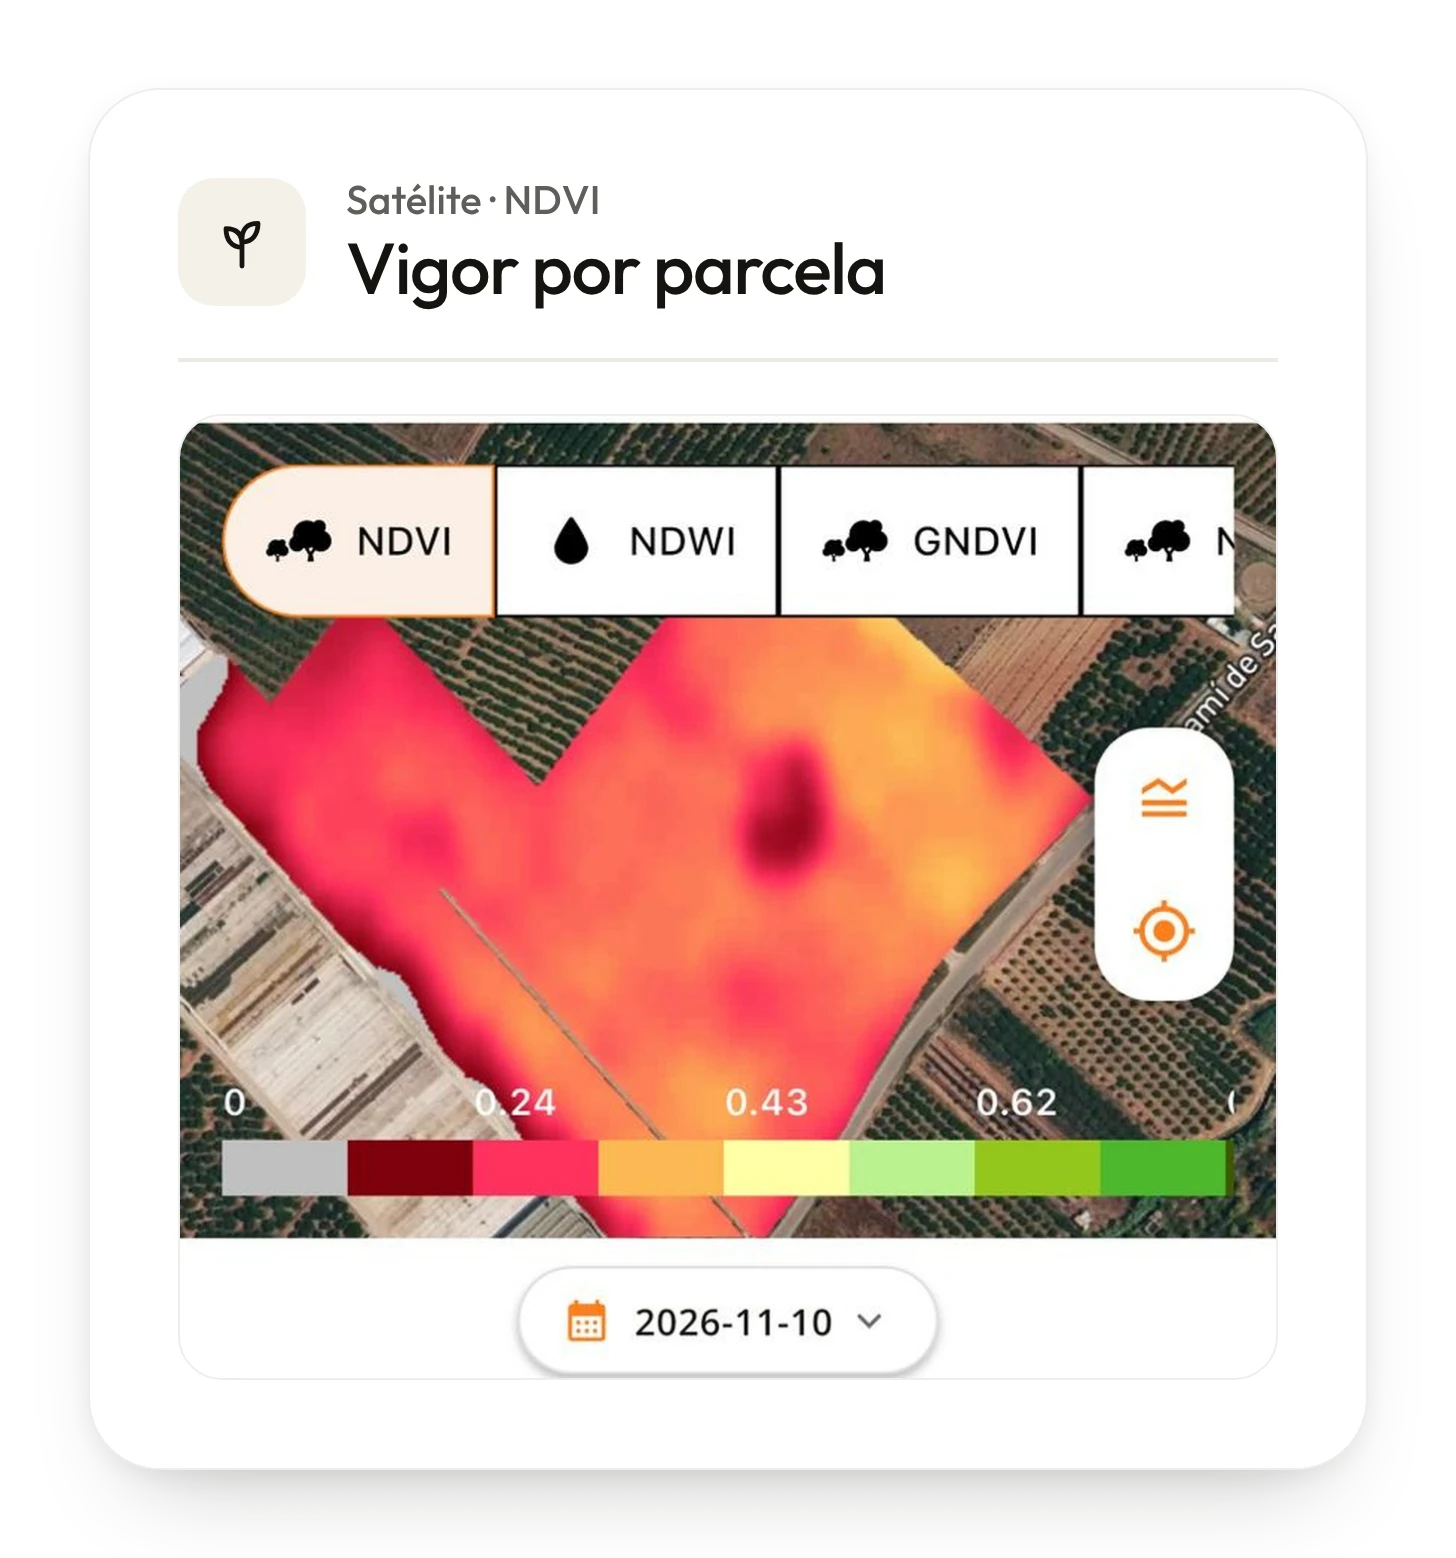
Where to act
See each plot’s vigour and the active alerts on the map.
Actions from the map
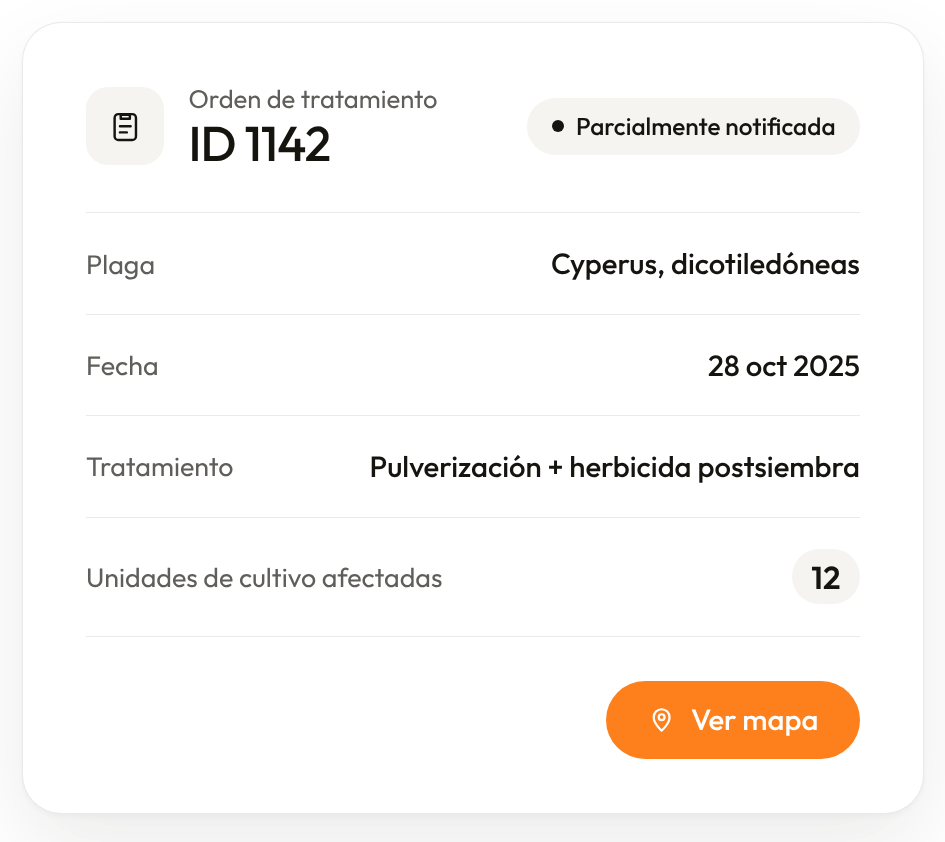
Launch an order or a work report from the plot itself and review it before sending.
Measure and photograph
Measure areas and save geotagged photos.
Shall we talk?
Tell us which process you want to start solving.
Book a demo